Dashboard Introduction
A Grafana Dashboard is a visualization tool used to present monitoring data through charts, tables, and other visual formats. It pulls data from the Prometheus data source and organizes it into a visual interface, helping users monitor and analyze system performance and status in real time.
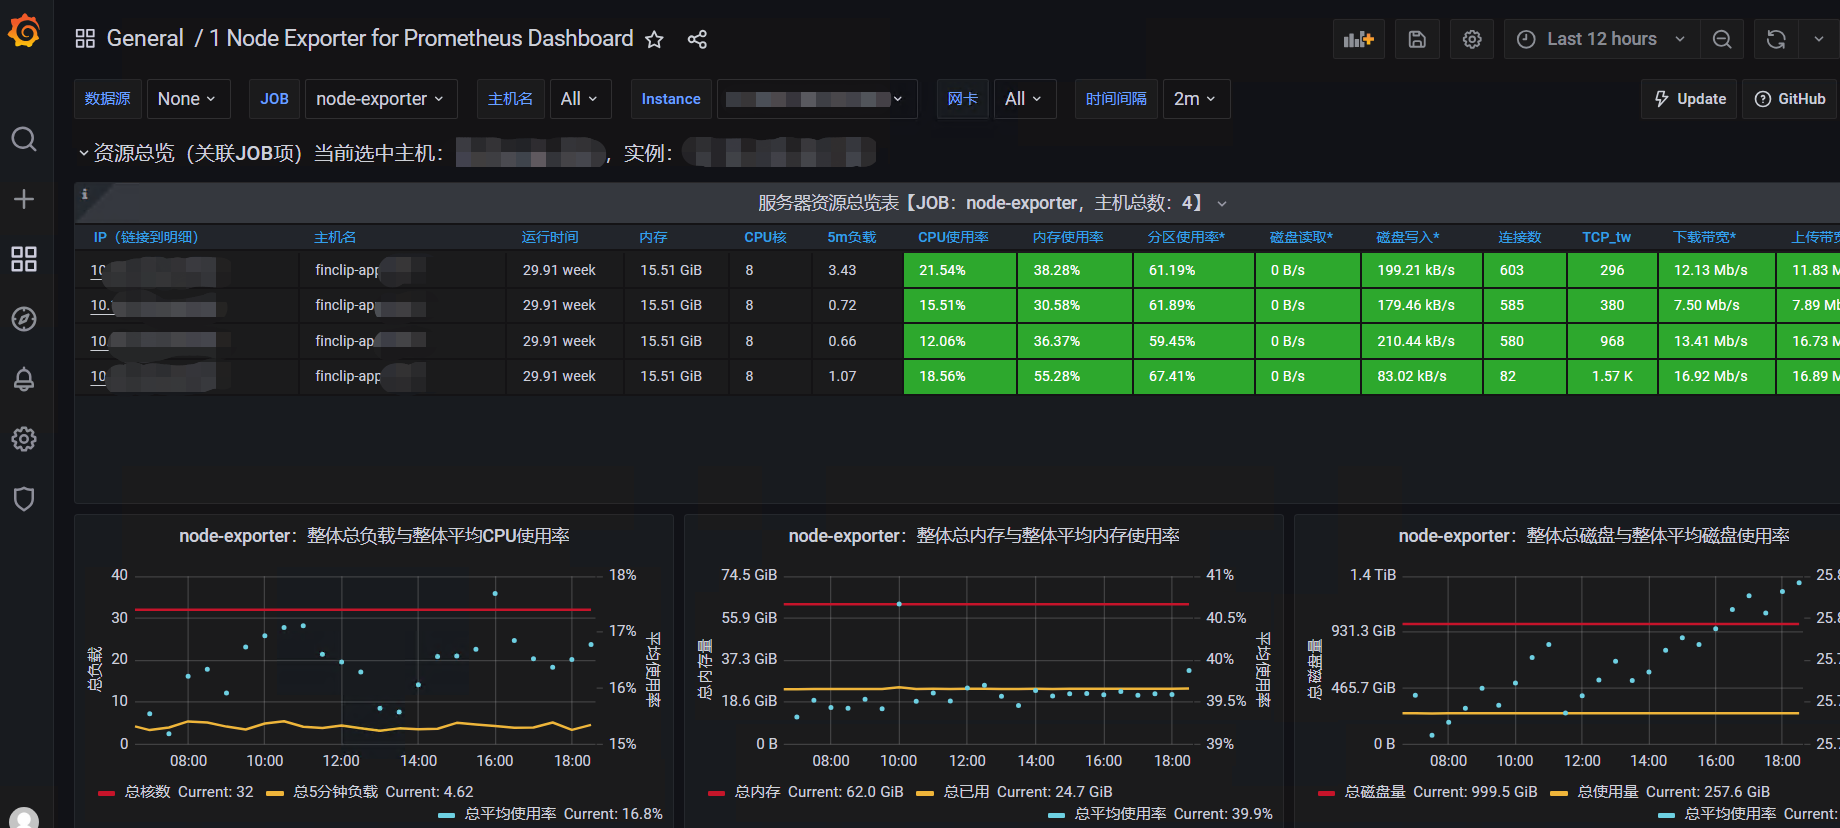
Node Monitoring
Data Source
Node monitoring is primarily based on Prometheus node_exporter metrics.
Key Metrics
- CPU utilization: Shows the real-time CPU usage of each node.
- Memory utilization: Used and remaining memory capacity of nodes.
- Disk I/O: Disk read/write rates of nodes.
- Network traffic: Inbound and outbound network traffic of each node.
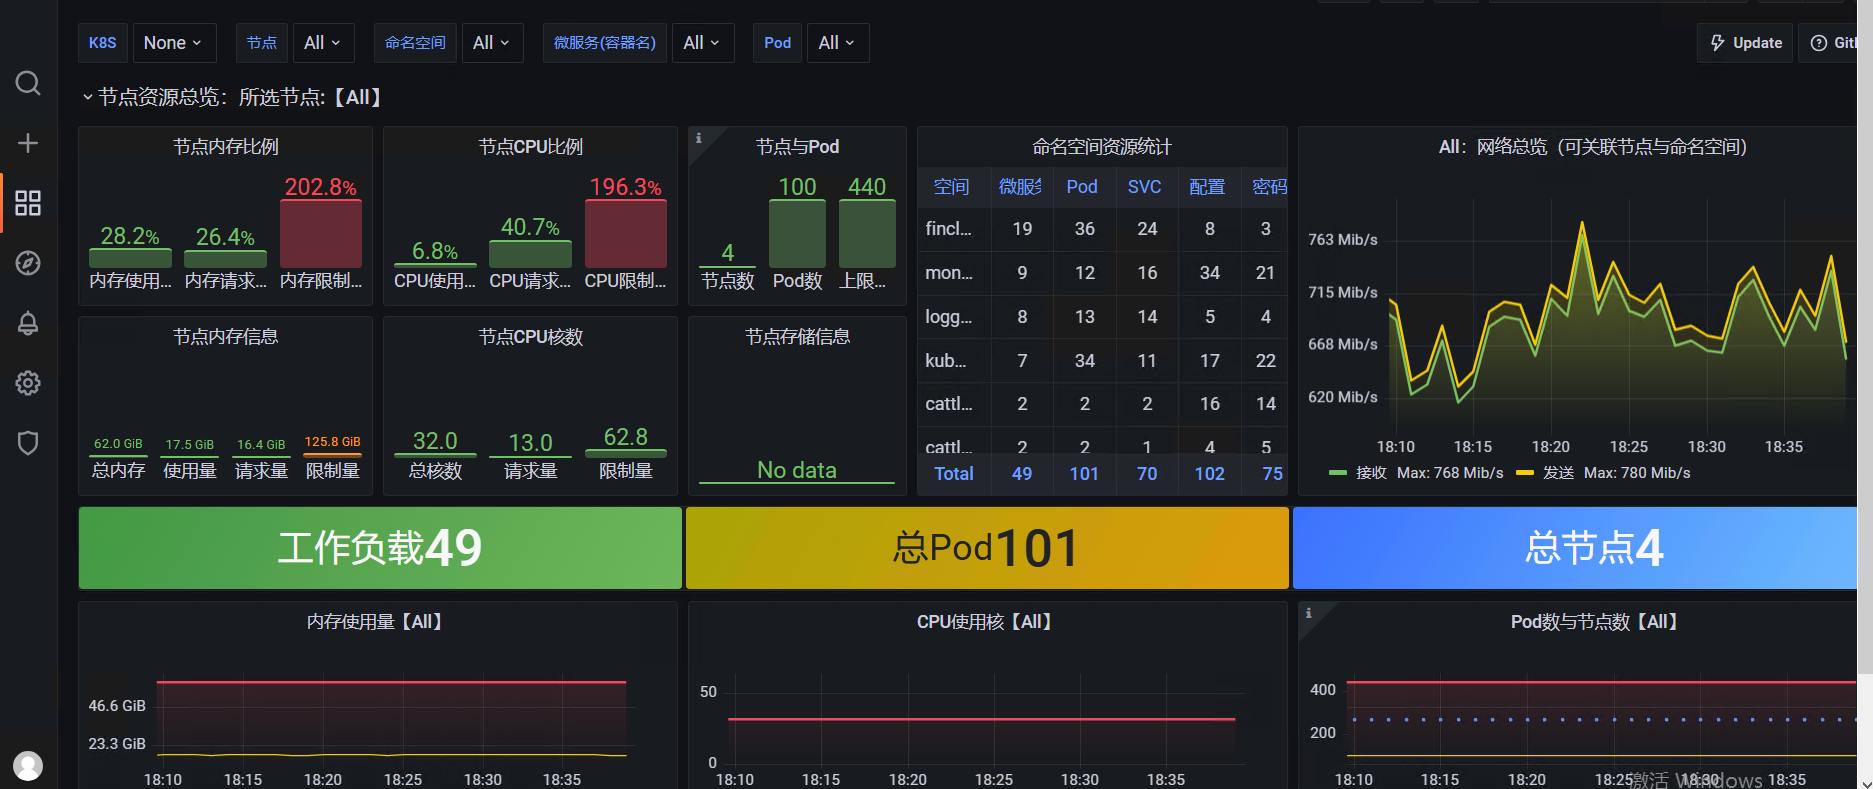
K8S Monitoring
Data Source
K8S monitoring is based on Kubernetes kubelet and cAdvisor metrics.
Key Metrics
Pod monitoring: Running status, restart count, resource allocation.
Namespace monitoring: Overall resource usage within a namespace.
Workloads: Health status of Deployments, StatefulSets, DaemonSets, etc.
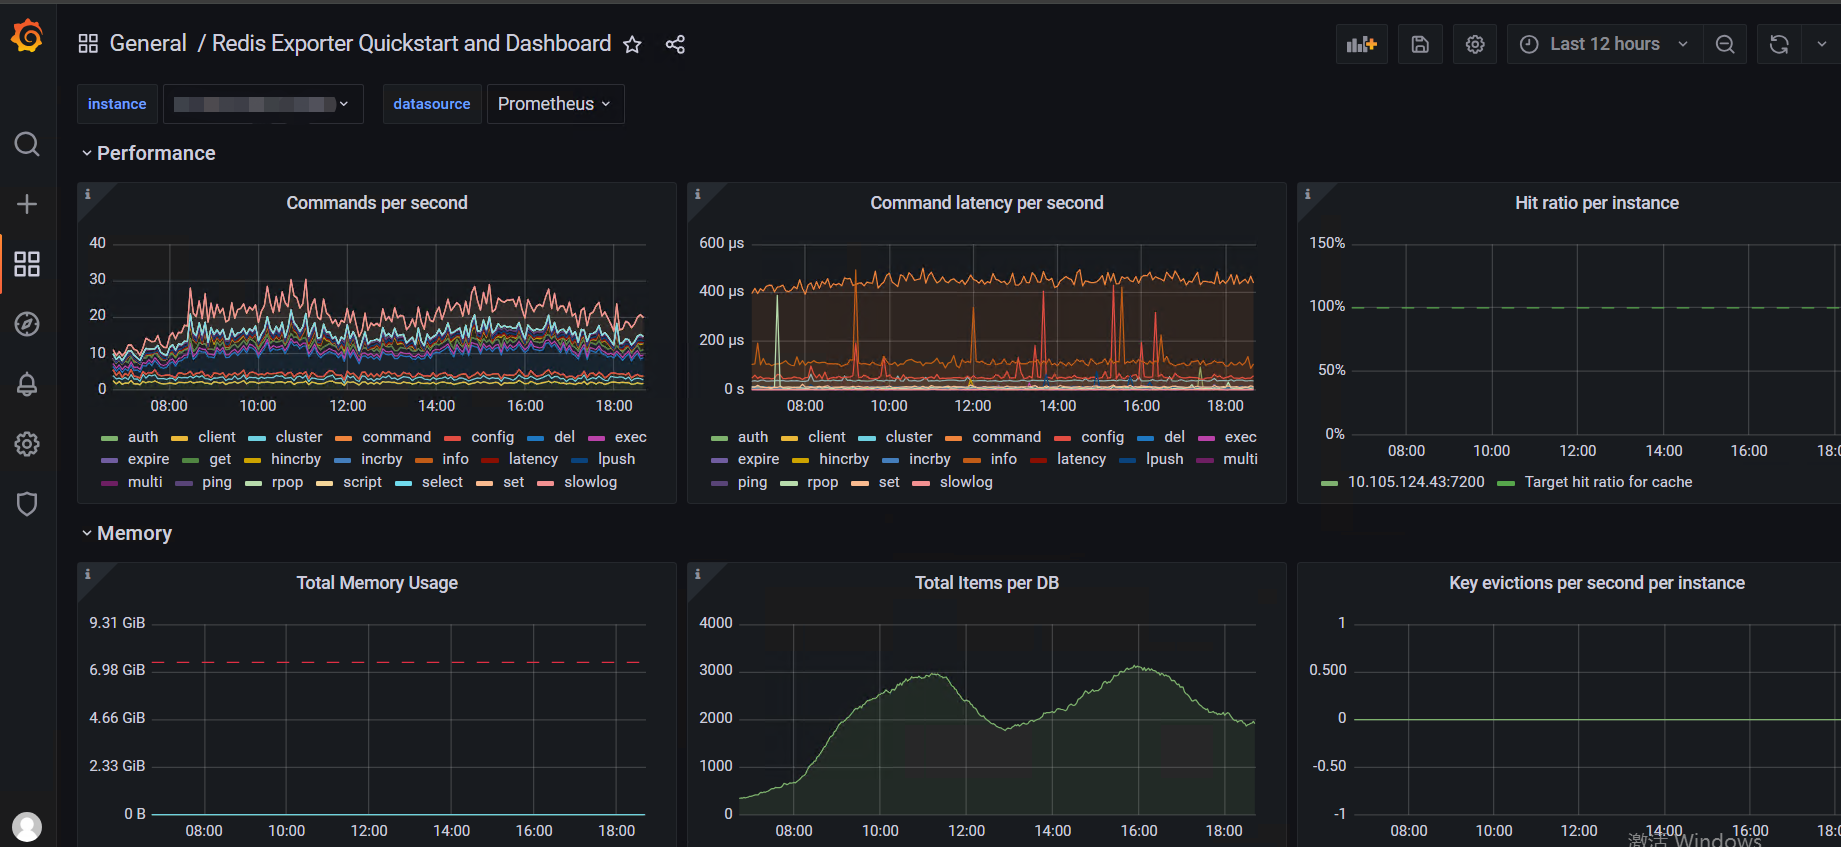
Redis Monitoring
Data Source
Redis monitoring is based on metrics provided by redis_exporter.
Key Metrics
- Hit ratio: Ratio of hits to misses for key requests.
- Memory usage: Total memory used by the Redis instance.
- Connections: Real-time number of client connections.
- Operation rate: Number of commands executed per second.
- Replication status: Shows the latency and health status of master-replica replication.