
System Overview
In modern software operations, log collection and analysis are essential. Our log collection system is built on Promtail, Loki, and Grafana, providing an efficient and powerful solution. It can collect logs from complex system environments, store and manage them effectively, and, through an intuitive visualization interface, help operations and development staff quickly obtain valuable information for system monitoring, troubleshooting, performance analysis, security auditing, and many other scenarios, ensuring stable operation and continuous optimization of the system.
Built on the open-source components Promtail, Loki, and Grafana, our log collection system forms an efficient log collection and analysis platform that can collect, store, and display the log data of application services in real time.
System Architecture
As shown in the diagram below, the logging system comprises three core components: Promtail, Loki, and Grafana. As the log collection tool, Promtail is responsible for extracting logs from each service and sending them to Loki. Loki is responsible for storing the log data, and Grafana provides powerful log visualization and querying capabilities, helping users quickly locate problems and monitor service health.
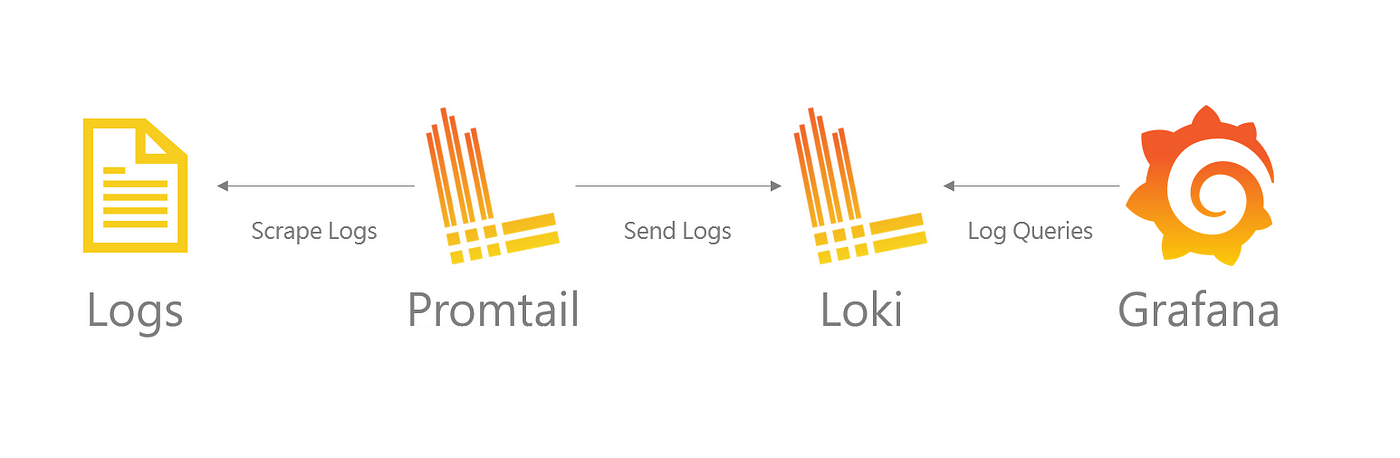
Component Introduction
1. Promtail
- Function: Responsible for collecting logs from various sources (such as containers, application log files, etc.) and sending them to Loki. It supports classifying logs through log labels and parsing multiple log formats.
- Advantages: Lightweight, able to efficiently collect logs from containers and the file system; supports integration of multiple log sources, with flexible configuration options that let users customize their log collection strategy.
2. Loki
- Function: Loki is a horizontally scalable log aggregation system, similar to Prometheus but optimized for log data. It separates log storage from indexing and uses a time- and label-based indexing approach, enabling efficient storage and querying of large volumes of logs.
- Advantages: Efficient storage and query capabilities, with seamless integration with Promtail; low latency and a distributed architecture able to meet the needs of large-scale log data.
3. Grafana
- Function: Grafana is an open-source visualization tool used to display log data from Loki. Through Grafana, users can create powerful dashboards and charts, supporting real-time log querying, display, and alerting.
- Advantages: Supports multiple data sources, powerful visualization capabilities, flexible query features, and a rich plugin ecosystem, making it easy for users to create custom monitoring views.
Example Scenarios
Scenario 1: Log Anomaly Monitoring
Configure log collection rules so that when keywords (such as "ERROR" or "Exception") appear in application logs, Loki stores that log data, and a Grafana dashboard displays the count and details of anomalous logs in real time, helping operations staff quickly locate problems.
Scenario 2: Slow Service Response Log Alerting
Create a dashboard in Grafana to monitor the response time of each service. When a service's response time exceeds 5 seconds, Loki records the event and displays it in Grafana. Operations staff can view it in real time on the dashboard, quickly identify slow-responding services, and notify the relevant people by setting up alerting rules.
Scenario 3: Log Storage Optimization
As log volume grows, log data that is no longer needed must be cleaned up regularly. You can configure a log retention policy in Loki to automatically clean up logs by time or log level, ensuring the logging system runs efficiently and saving storage space.